Back
Bike Sales Dashboard in Excel
Project Details:
Explored bike sales data to determine how demographics such as income, gender, age, occupation and various others influenced consumer bike purchasing decisions. Used Excel tools to clean and manipulate the data, created pivot tables and an interactive Dashboard.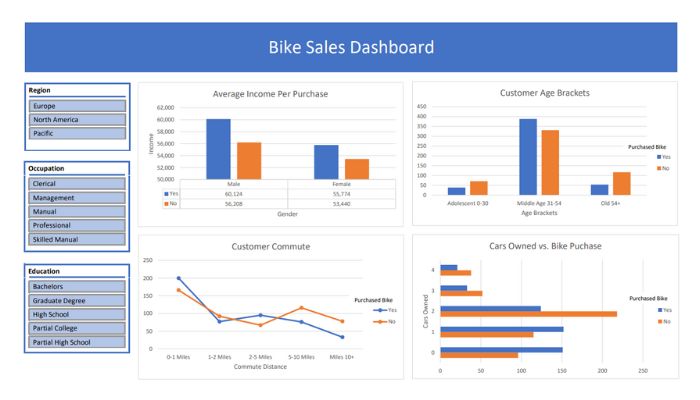
The full interactive Tableau Dashboard can be found Here
Insights:
- Customers who purchase bikes have a higher average income than those who don't.
- Those with a Professional occupation are more likely to purchase a bike.
- Those with a Bachelor's or partial college are also more likely to purchase a bike.
- The Middle Age Bracket (31-54) purchase the most bikes overall.
- The shorter the customer commute distance the more bikes are purchased.
- Customers who own only one or zero cars are more likely to purchase a bike
- Overall North Americans purchase more bikes than the other regions
Data Source:
This was a guided project as part of the Data Analyst Bootcamp. Excel-TutorialContact Me
Location
Miami, Fl
alsinajacks@gmail.com